Spatial reference systems (SRS) are the foundation for mapping and spatial analysis. The SRS allows you to relate spatial data to physical locations on the Earth — a process called georeferencing.
Spatial reference system (SRS)
Spatial reference systems fall into 2 categories: geographic coordinate systems (GCS), representing data on a 3d globe, and projected coordinate systems (PCS), representing data on a 2d map.
All spatial reference systems contain a datum, which models the shape of the Earth (with corresponding reference points/lines), and a coordinate system, which defines how to identify locations on the Earth.
Datums
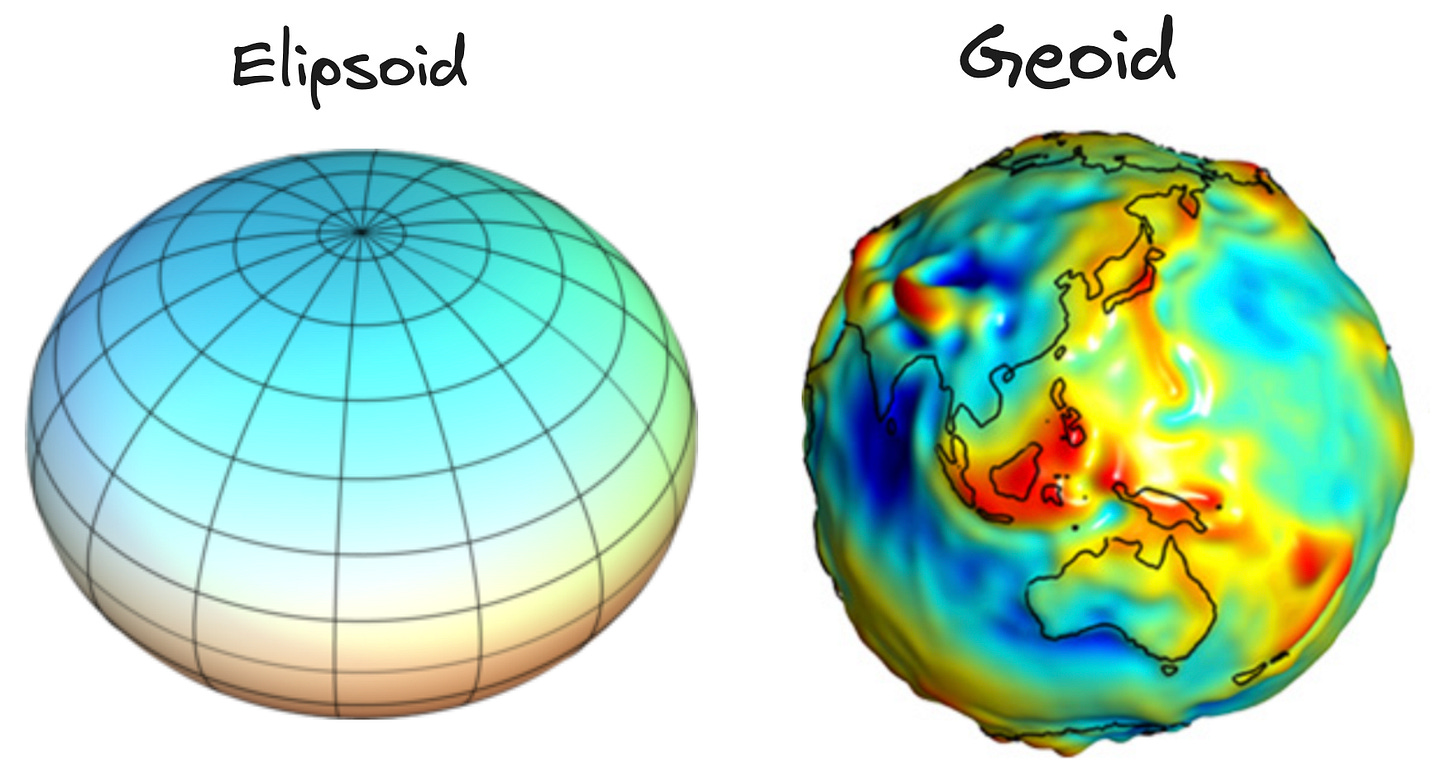
Most people think of the Earth as a sphere, but the Earth is typically modeled as an ellipsoid or a geoid (pronounced JEE-oid).
The ellipsoid is a smooth object, often used in GPS applications, whereas the geoid is bumpier and closer to the truth — taking into account sea level and gravitational variations.
In addition to the shape of the Earth, the datum contains reference lines and points, such as the center of the Earth, the Prime Meridian, and the Equator. Additionally a few control points are included — these are specific locations with precisely known coordinates that help establish the datum’s position and orientation.
Geographic Coordinate Systems (GCS)
A geographic coordinate system treats the Earth as a 3d object, where locations are identified based on their angle from given reference points/lines.
Latitude describes how far North/South a given location is by measuring the angle between the location and the Equator (where the angle’s vertex is the center of the Earth). Longitude does the same thing for East/West using the Prime Meridian.
The most common geographic coordinate system is the World Geodetic System 1984 (WGS 84). This is the GCS that underpins Google Maps/Google Earth.
Projected Coordinate System (PCS)
A projected coordinate system takes the 3d model of the Earth (with corresponding reference points) and projects it onto a flat 2d surface using a mathematical transformation.
You can think of the process of projecting as similar to peeling an orange and trying to flatten out the peel. Whenever any curved 3d surface is projected onto a 2d surface, there will be some amount of distortion.
The types of distortion include the following:
Shape: does the projection distort the shape of features?
Area: does the projection expand or compress the size of features (is the area proportional to the features actual size)?
Distance: are the distances between features accurate and consistent across the map?
Direction: does the projection preserve direction — in other words — if you follow a path along a constant direction (e.g. exactly North-East), does the path1 appear on the map as a straight line?
While we can’t eliminate all distortion, fortunately we can adjust the tradeoffs between different types of distortion to select the best projection for a given task.
For example, the mercator projection preserves direction, which means a straight line on the map corresponds to a constant compass direction (or bearing). This makes it very useful for navigation. However, the Mercator projection dramatically distorts area, expanding features near the poles and compressing those near the equator. This makes Greenland looks larger than Africa, where in reality, Africa is ~14 times larger than Greenland by Area.
Let’s take a look at 2 different projections:
Web Mercator has become the de-facto projection for most web-based maps. but if your task is comparing the size of different land masses, Web Mercator is a poor choice. Using a globe or a projection like Lambert conformal would produce better results.
Coordinate system in a PCS
Because the map in a PCS exists in 2 dimensions, it no longer makes sense to measure coordinates based on latitude and longitude (which are angle measurements using the center of the 3d Earth as the vertex). Instead, coordinates are assigned an X, Y value on a Cartesian plane (i.e. a 2d grid). The X value is referred to as an Easting, and the Y value is referred to as a Northing. The unit of measurement is meters — an Easting tells you how many meters East or West you are from a given reference line (e.g. Prime Meridian), and a Northing tells you how many meters North or South you are from a given reference line (e.g. Equator).
Although PCS technically uses X,Y coordinates, most maps are labelled with their GCS counterparts — latitude and longitude — out of convention and familiarity.
Spatial Reference Systems: Analysis and Mapping
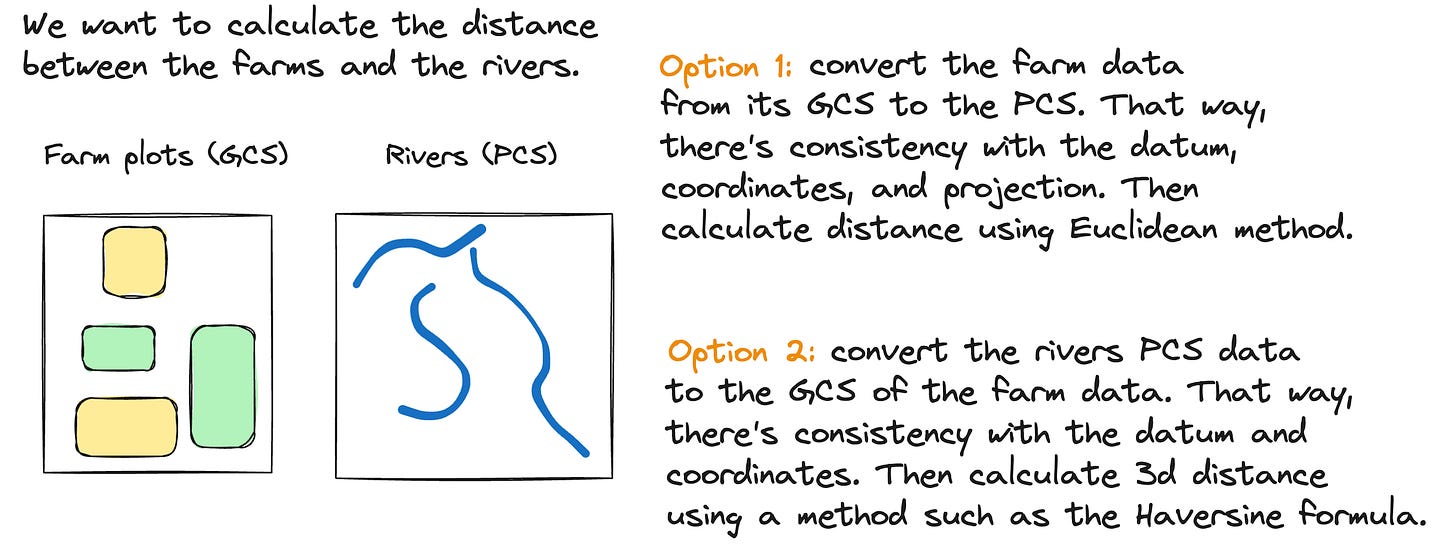
If you have data sets with different SRS’s and you want to either overlay them on the same map/globe or perform calculations on them, it’s important that you standardize all the data to use the same SRS.
Many spatial calculations involve calculating distances. In a 2d world, distances are calculated using Euclidean distance. In a 3d world, the calculation is more complex, relying on trig functions to calculate the length of an arc along the Earth’s surface.
If you are performing a distance calculation between 2 sets of data, you need to make sure both data sets are using a consistent Spatial Reference System.
There are a variety of different transformation scenarios involving different GCS’s and PCS’s:
GCS1 ←→ GCS2
PCS ←→ GCS
PCS1 ←→ PCS2
And there are different mathematical transformations that allow you to go from one system to another:
If you don’t standardize on the same SRS when performing analysis or mapping, you risk wrong calculations and incorrectly placed features on the map2.
All of these topics can be explored in much greater depth, including the biases and tradeoffs of different datums, projections, calculations, and transformations, but I hope this was a helpful primer into the world of GIS and its many terms.
a path following a constant compass bearing is called a rhumb line
Not all errors in calculations or alignment are due to differences in SRS — there are many other ways to make mistakes!


