The SQL that Tableau writes for LOD's
Tableau writes sql to self join a table with an aggregated version of itself
In the post about calculations in Tableau, I discussed row-level vs aggregate calculations. To recap:
Row-level calculations return a result for every row in the underlying data (e.g. [Sales] * [Discount] is a row-level calculation).
Aggregate calculations run across multiple rows of underlying data and return a single summary value, which can be “sliced and diced” with different dimension values (e.g. Sum of Sales by Category and Region).
So what exactly is a level of detail (LOD) expression?
The answer is complicated — it’s a row-level calculation, but it doesn’t return a result for every row of the underlying data — instead, the LOD acts as a row-level calc across an aggregated sub-query.
Let’s look at a few calculations to see how the LOD expression sets the level of detail for the sub-query:
{Fixed [Category] : Sum([Sales])} → level of detail is Category
{Fixed [Category], [Region] : Sum([Sales])} → level of detail is Category-Region combination
{Fixed : Sum([Sales])} → level of detail is the whole table because we did not specify a dimension. This is called table-scoped.
We’re not going to explore an LOD example for cohort analysis at the SQL-level.
Customer’s first purchase cohort and an analysis of the SQL
To demonstrate how an LOD calculation get translated into SQL, let’s run a performance recording for a cohort analysis example. Performance recordings show you the underlying SQL that Tableau is sending back to the database.
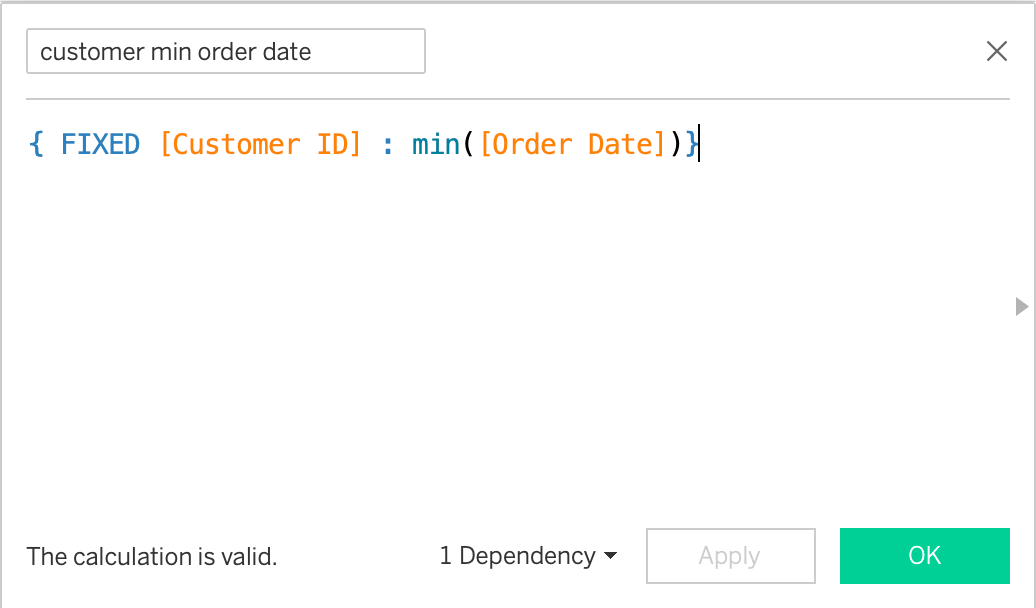
I created an LOD that calculated the minimum Order Date for each Customer ID. This LOD will allow me to segment my customers into cohorts based on when their first purchase was.
Below is the calculation:
Next we will create a Sum of Sales by Month viz — then drag our LOD to color with the date part set to YEAR.
This viz is now giving me 4 colored lines — each is representing the sum of sales by each cohort — customers who first purchased in 2020, customers who first purchased in 2021, etc.
From running the performance recorder, we get the below SQL that Tableau wrote to make this viz:
Tableau is joining the orders table to an aggregated subquery of itself. Let’s break it down in a little more detail:
As the diagram shows, the LOD calc creates a subquery. This subquery gives us Customer ID’s and their first order date. The subquery is then joined together with our orders table on customer ID. Our select statement is grabbing sum of sales grouped by month of order date, and year of a customer’s first order date. Kind of a lot going on!
Here’s a simpler portrayal of what’s going on in the query above:
Closing thoughts
LOD’s are strange but provide a lot of flexibility. I encourage you to play with different LOD expressions, then change the aggregation on top of them to see how they behave. As you saw from the SQL, sub-queries and self joins can become expensive operations that affect performance. It’s typically worth reserving LOD’s for scenarios where you can’t get away without them. Sometimes a set, or a table calc, or preprocessing the data before Tableau can also solve your problem.
Thanks for reading, and I would love to hear your questions, comments, or suggestions below.


