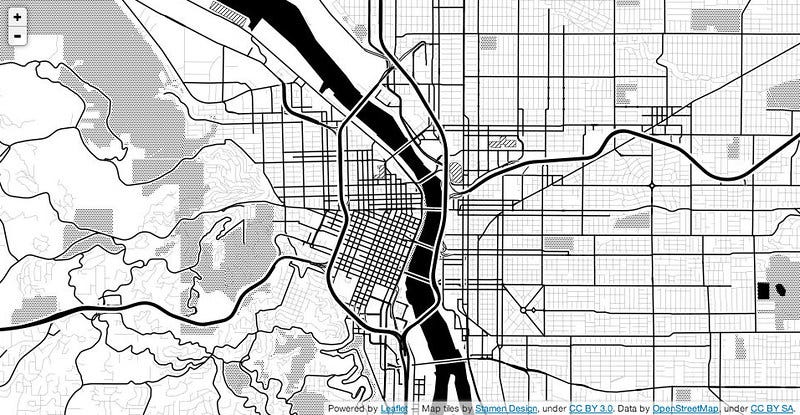
Plotting an interactive map with Google Collab and Folium
Link to YouTube walkthrough
Link to Google Collab notebook
This post will give you the basic skeleton to begin creating interactive web-based maps. We will be using Google Collab to demonstrate.
This is a follow up to the bulk geocoding post where we generated coordinates (lat/lon) from a CSV of street addresses.
Step 1: Install GeoPandas
We’ll be using the GeoPandas library to work with our spatial data
Step 2: Create GeoDataFrame and plot static map
Once we create our GeoDataFrame (i.e. data frame that supports spatial data types and operations), we will plot our map using the native plot function.
Step 3: Import Folium and plot interactive map
Folium is a Python library that wraps around Leaflet.js. With Leaflet, we can create a light weight interactive map in the browser.
Step 4 (optional): Download the html for the map
If you want, you can download the html for our map and use it wherever you want!
Step 5 (optional): Download the geojson file for the coordinates
If you want to take the coordinate data and use it in other mapping software, you can download the data in geojson format.


