Calculated fields in Tableau
Calculations in Tableau are useful for summarizing your data, creating new fields (either measures or dimensions), cleaning your data, and applying advanced filters. We’re going to explore the various calculation types and their different behaviors and uses.
Overview of calculations
Aggregate calculations are functions like sum, average, count that return a summary value. They behave like a pivot table in Excel. These calculations are executed in the database.
Row-level calculations are functions that act on each individual row, returning a calculated value for each row. These calculations are also executed in the database.
Table calculations are functions like window_sum, window_avg, or rank that run on top of the result set. These calculations are similar to SQL window functions, but instead are executed in memory in Tableau after the database returns the result set.
Level of detail calculations use special operators (e.g. Fixed) to perform calculations at a different level of detail than the current result set in the view. LOD’s are powerful but not the most performant as they cause Tableau to produce a subquery that is then joined back to the original data set. LOD’s are executed in the database before regular aggregate or row-level calculations.
Set operations in Tableau are really powerful and arguably their own category, but we will address them in a different post.
Let’s go through each type!
Aggregate Calculations act across multiple underlying records
Aggregate calculations involve functions that run on a subset of data and return a single summary value. The collection of summary values create what we call the result set of the view.
Aggregate calculations can be performed in Tableau in 2 ways:
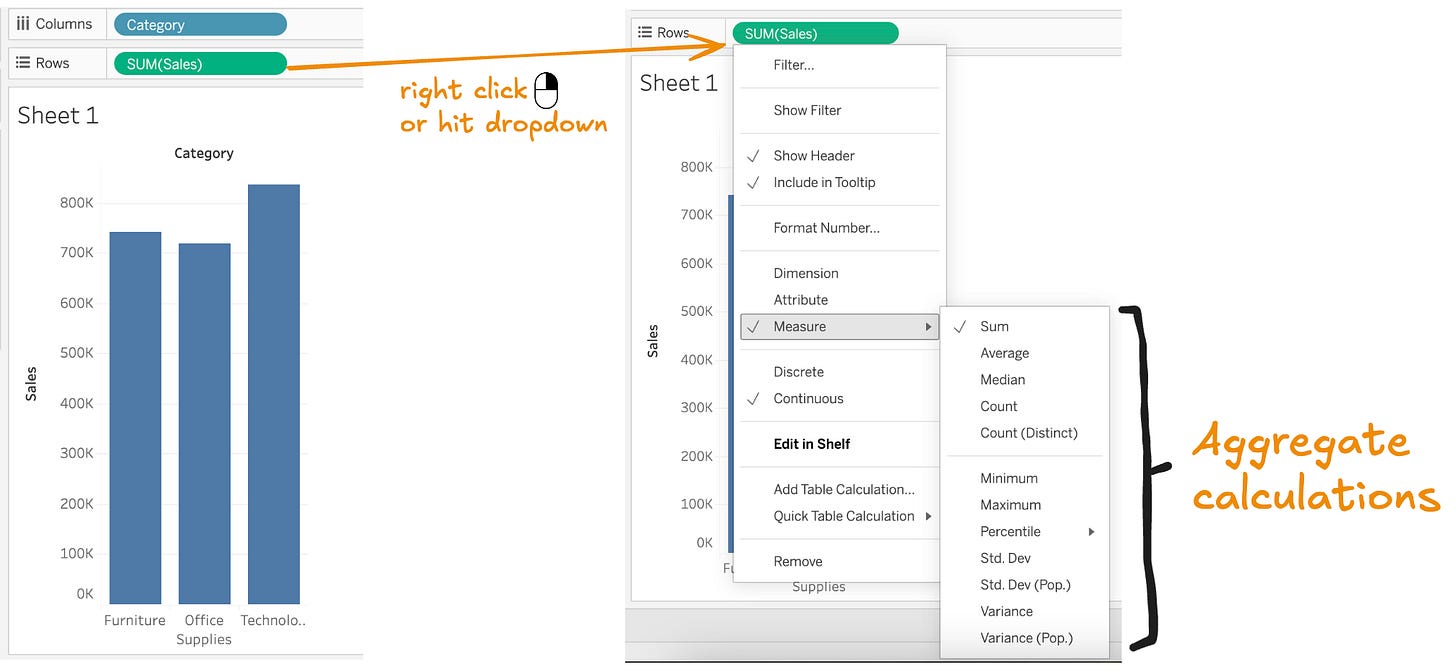
Dragging a measure onto rows/columns, then changing the aggregation type through a menu option
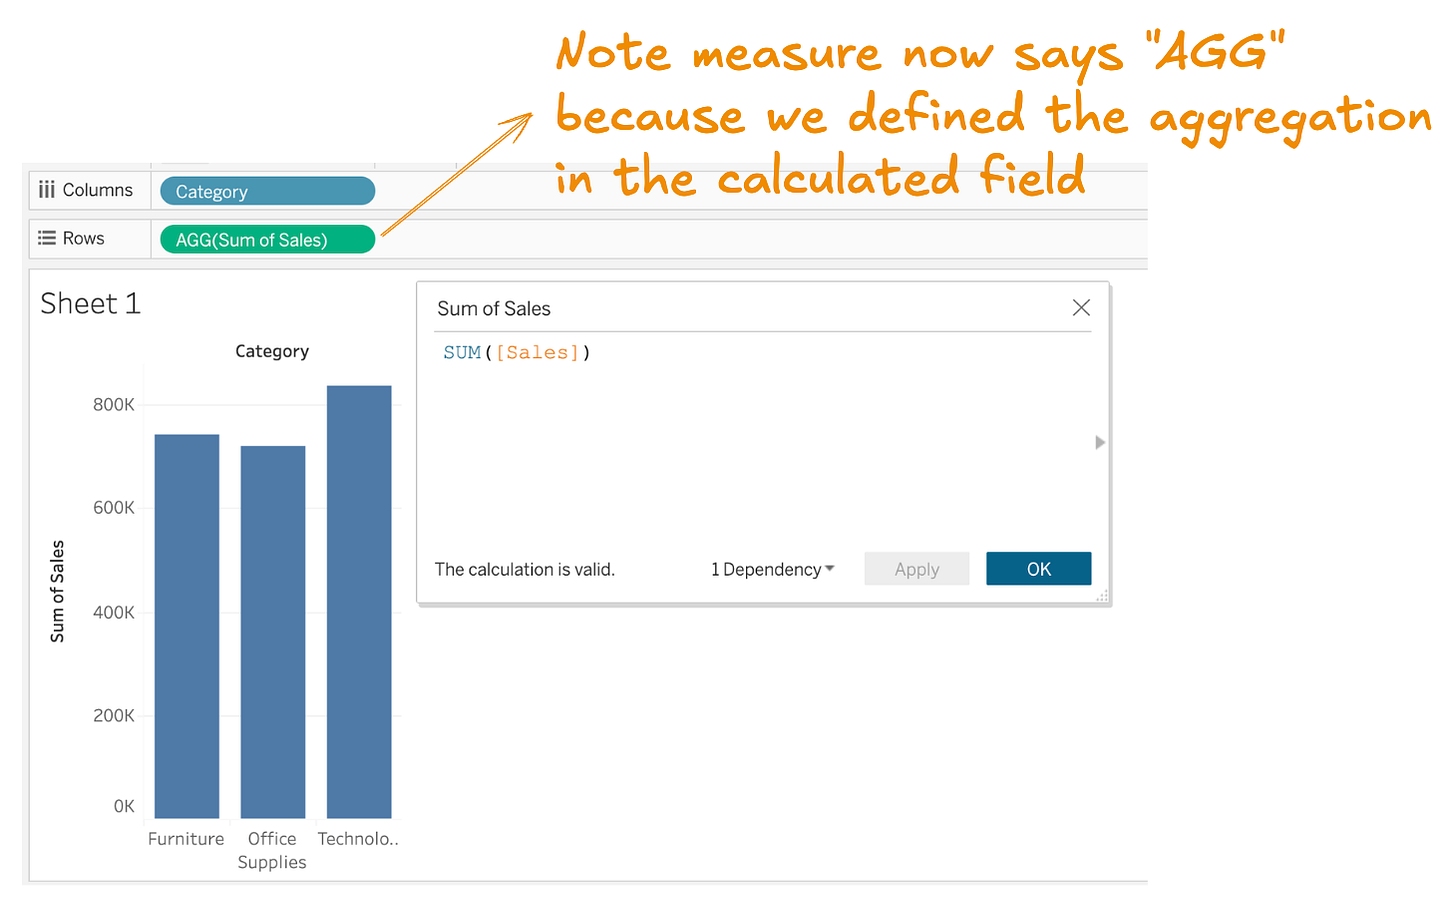
Creating a calculated field that contains an aggregation function along with a measure
Let’s look at some examples using Tableau’s Superstore data (top result on this page).
We’ll begin with the first method — creating aggregations via the GUI. Let’s start by dragging the dimension [Category] to columns and the measure [Sales] to rows. This creates a result set that partitions the data into 3 categories and sums up the sales across all the underlying rows for each 3 categories. Sum is the default aggregation type — you can change the aggregation to average, median, count, etc.

Let’s now walk through the second option — creating an aggregate calc using calculated fields.
We can recreate this example using a calculated field instead. If you create a new calculated field called Sum of Sales and set it to Sum([Sales]), then you drag this new field to rows, you will notice that Tableau now displays the field as AGG([Sum of Sales]) because we are defining the aggregation in the calculated field itself.
In both examples, the aggregate calc applies an operation across multiple rows of underlying data then displays the results in the result set of the view or sheet.
Row-level calculations apply individually to each underlying record
Let’s look at a couple examples of row-level calculations — again using Superstore data.
String example:
In this example, we are using a row-level calc to create a new calculated dimension field that manipulates a string field — in our case, replacing the dashes with underscores in [Order ID].
Numeric example
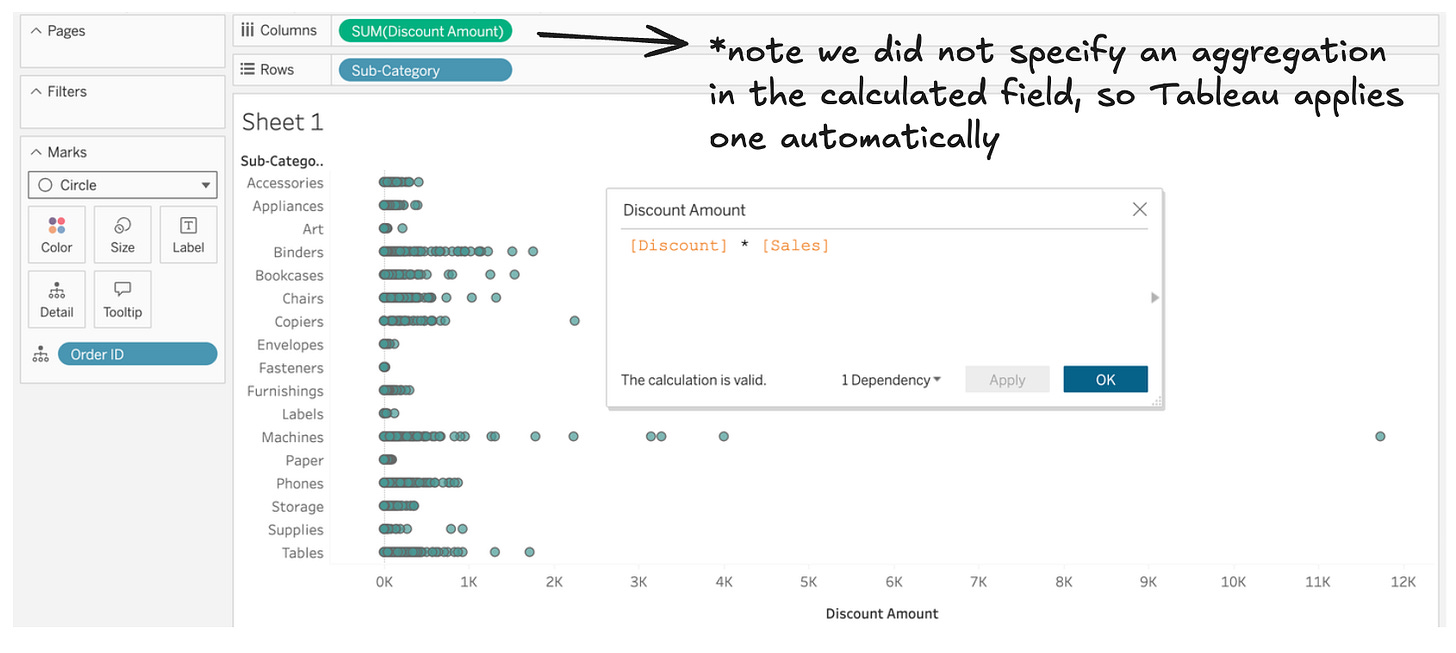
In this example, we are multiplying 2 measure fields together to create a new calculated measure field.
A row-level calculation applies an operation to each individual row in the underlying data.
Quick aside: Ratio of sums ≠ Sum of ratios
An illustrative example of a potential mistake involving row-level vs aggregate calculations is ratios.
Let’s take profit ratio as an example. Profit ratio is calculated as profit over sales. But which of the following approaches is correct:
Row-level: Create a calculation called Profit Ratio as [Profit] / [Sales] → drag that to columns or rows, which creates: Sum([Profit Ratio])
Aggregate: Create a calculation called Profit Ratio as Sum([Profit]) / Sum([Sales]) → drag to columns/rows, it shows Agg([Profit Ratio])
The row-level approach divides the profit by the sales for each row. The resulting row-level ratios then get summed up across all the rows. The aggregate approach sums up the profit across all the rows, sums up the sales across all the rows, then divides them. You can test it out to confirm, but the aggregate approach is correct in this case. The row-level approach will give invalid results (unless you’re filtered down to only a single row of data).
Table Calculations
Table calculation perform operations on the result set of the view/sheet, as opposed to the underlying data.
Table calculations include running total, percent of total, moving average, etc.
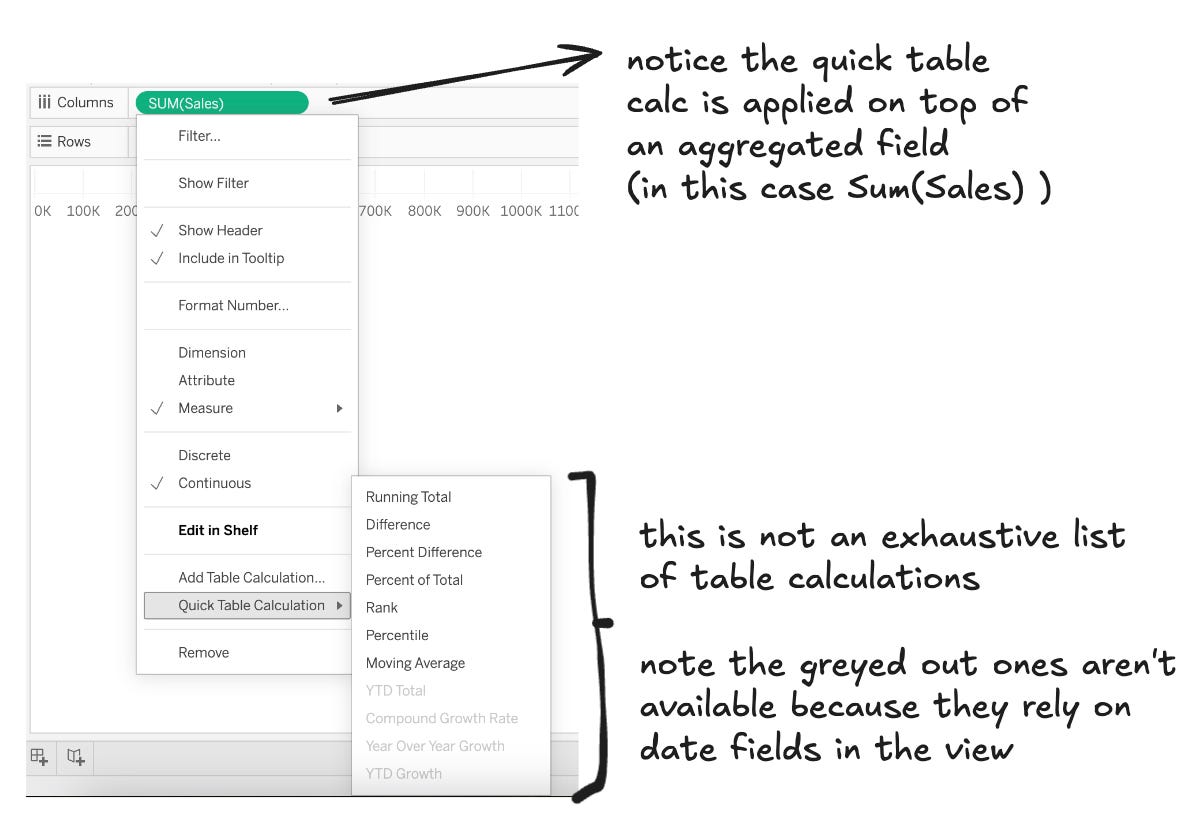
Quick table calculations are selected through the UI
Table calculations can be created by menu options in the UI. Once you have a measure in your view, you can select quick table calculation to see a list of commonly used options.
Table calculations via calculated field dialog
Tableau’s calculated field dialog has a long list of all the available table calculations you can use.
If you drag a table calculation that you made using “quick table calculation” to the blank space in a calculated field dialog, you can see the underlying calculation syntax. The video below demonstrates that:
We need to tell Tableau how we want our table calc to run
Let’s look at an example of calculating the percent of total on the result set shown below:
As you can see there are various ways to express percent of total. What is the default behavior if I select percent of total quick table calculation:
In that case, the percent of total is calculated across by region for each category-sub-category combo. We can validate that by dragging in a grand total across the rows.
Tableau let’s you customize how table calcs get executed using the compute using and edit table calculation options:
For a nice deep dive on controlling how table calculations run, check out this link.
Quick note on TabPy and Analytics Extensions
TabPy is a type of analytics extension in Tableau that let’s you execute Python code inside your Tableau workbook. TabPy is a table extensions, so as we mentioned, the logic in your TabPy calculation is applied to marks in the result set of your viz/sheet.
Level of detail (LOD) calculations
Level of detail calculations are probably the least intuitive type of calculations in Tableau. They can either be row-level or aggregate, but what makes them special is you can define the level of detail (aka granularity) of the calculation in the calculated field dialog, as opposed to inheriting whatever granularity is established in the view. For a refresher on granularity, refer here.
The 3 types of LOD calcs are fixed, include, and exclude. Fixed is the most commonly used and most intuitive. It tells Tableau to ignore the level of detail of the view and let the calculated field establish what level of detail to use.
Let’s illustrate with an example:
For a breakdown and deep dive of Fixed, Include, and Exclude, check out this link.
Order of ops
We mentioned this at the beginning, but let’s return to order of operations.It’s important to consider the order of ops because often times, these calculations are mixed and matched within a single worksheet or dashboard.
LOD’s occur before aggregate calculations. Table calculations occur after aggregate calculations because they offer additional aggregation on top of the result set. LOD/aggregate calcs all occur in the database, where as table calculations occur in Tableau itself.
For a more detailed exploration of order of operations, it’s worth reading Tableau’s documentation.
Closing thoughts
As the saying goes, there’s more than one way to skin a cat. Similarly in Tableau, there are often various approaches to solve a certain problem. For example, percent of total can be derived using a quick table calculation or a LOD. Cohort analysis can lend itself to sets or LOD’s. And sometimes, you want the calculation logic to be materialized in the database, instead of in Tableau.
I hope this gives you a nice survey of the different calculation options available in Tableau.


